My volunteering organization's manager asked me if I could print organizational charts to display who is in which position in a hierarchical way (150+ positions). That way, it would help him to see which positions are vacants, to understand who has been there for a long time, and so on.
I accepted the challenge.
It took me 2h30 to find how to scrap the data, and 3h to write a converter using Editor. a new tool I developed at the University of Chicago with an awesome team to dynamically create data-based documents in a very flexible way. Editor enables both the edition of the code as well as the edition of the final document using advanced bidirectional evaluation techniques, and runs as an http server.
In this article, I will report on my experience using Editor (as of today, January 16th, 2019), to solve the problem above.
The example is available for download there and the final solution is in a separate branch. To run and tweak the example, after installing Editor, run editor --openbrowser inside the folder.
Challenge accepted
Organizational charts were a perfect fit for Editor. I was first able to scrap the organization's data and pictures associated to the positions in our local organization. Basically, the input data was
type Input = List (Posision, (Name, StartDate))
where the Position, Name and StartDate are all aliases of strings.
As an example, such data could have been:
input = [
  ("Project manager", ("Ravi Chugh", "2013")),
  ("Research manager", ("Mikael Mayer", "2017")),
  ("Research Apprentice", ("Mikael's son", "2018")),
  ("Research manager2", ("Brian Hempel", "2015"))]
My manager already had made organizational charts last year using PowerPoint, but they were quickly outdated since many people moved in and out. He was tired of updating them by hand. He handed me those charts. I looked at them. They also contained Position, Name, the picture, and the starting date, but in a hierarchical way, some positions appearing multiple times.
These organizational charts consisted of a leader that supervises many leadees, which might be in turn leaders for other sub-organization charts. I decided to encode a chart using the following type:
type OrgChart = Leader Position (List OrgChart)
An example of chart could be the following:
chart =
  Leader "Project manager" [
    Leader "Research manager" [
      Leader "Apprentice" []
    ],
    Leader "Research manager" []
  ]
Then I created a recursive function that would transform an OrgChartto an HTML element <div> , including the sub-charts, looking up the position name into the input data to fill the name, picture and start date, and voilà, after some css, I got printable organization charts:
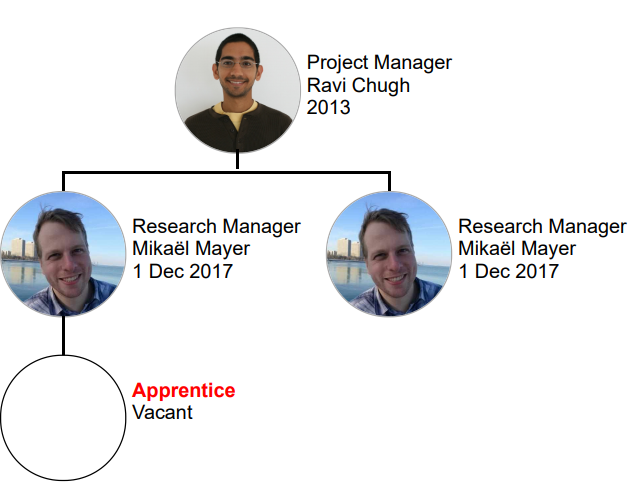
Well, something is wrong, obviously. The usual way to fix this problem is to fix the tree in the code so that the positions match the inputs (Research Apprentice instead of Apprentice, or Research Manager2 instead of Research Manager for the second time). But at the same time, we still want to keep these shorter names in the organization chart.
Editor's unique features
Editor made the tweaking process much easier.
- First, Editor enables me to rename the positions directly on the view depicted by the screenshot above. For example, after renaming right next to my second picture 'Research Manager' to 'Research Manager2', the picture and the name update automatically and we get the following chart:
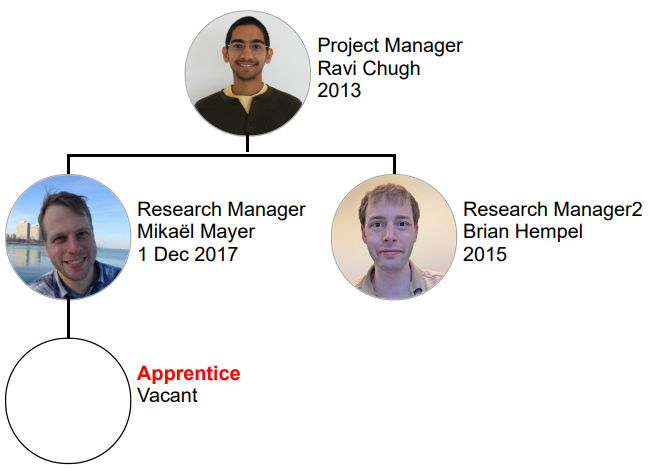
- However, it's not useful to display the "2" of "Research Manager2". We want to display "Research Manager" anyway. The way to do this is to normally create a list of renamings:
renamings = [("Research Manager2", "Research Manager")]and use this list to compute a display name using the code below:
listDict.get position renamings
|> Maybe.withDefaultReplace (freeze position)
(\posDisplayName -> -- Do whatever with the display name)
This solves the problem above.
Even better, if I now visually rename my position to "Researcher", it automatically adds the line("Research Manager", "Researcher")to the listrenamings!
Let me explain this step by step. When displaying my position,positionequals "Research Manager". the first line thus returnsNothingsince there is initially no renaming, and the second line returns "Research Manager" which is assigned toposDisplayNamethat is used to display the name in the viewport.
If I now visually rename my position, let's say to "Researcher", the second line back-propagatesJust "Researcher"back to the first line, which in turn -- since it returnedNothingpreviously -- adds the line("Research Manager", "Researcher")to the renamings. The power of lenses! It was very useful to rename 150+ positions in context. - Now, if I corrected the position "Apprentice" by renaming it to "Research Apprentice", it might create such a renaming. Whatever, if the position is not found, I do not use the variable posDisplayName but the variable position so that modifications are not renamings for display but really modify the organizational chart itself, until it finds a position match.
- When a position in the organization chart was not found in the source data, I looked for positions in the source that could match and first displayed them when I hovered the unknown positions as suggestions on how to rename them.
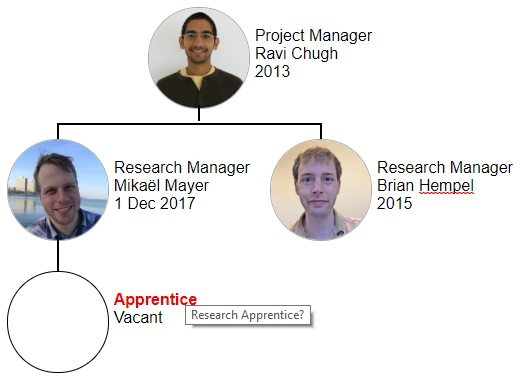
But Editor also provides an API of buttons that, when triggered, can "modify variables" on back-propagation. So I did. Given a suggestion that I computed, I created the button:Html.button suggestion "Is this the correct position name?" position (\oldPosition -> suggestion)
With 1 click I can now accept a suggestion that would replace the previous value of position in the organigram tree itself.
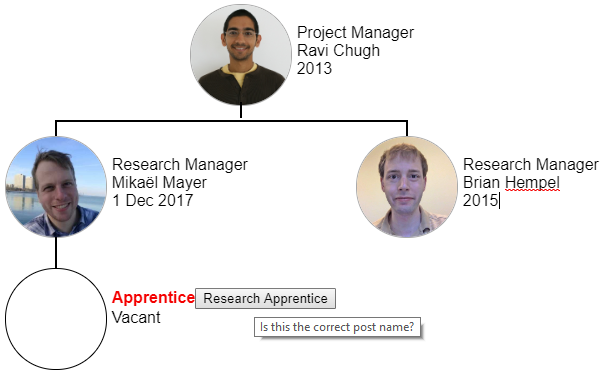
After clicking, we obtain the following: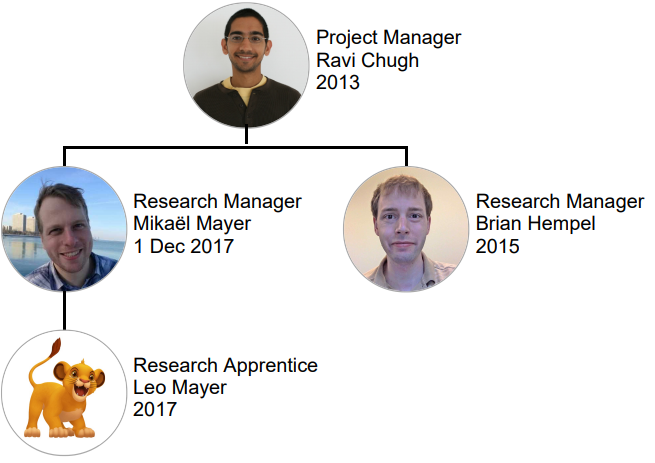
- Even though this is cool, I started to get tired of first clicking on a button to accept a suggestion, and then renaming the new position to match the position nickname what was in the original paper organization chart.
Oh, but this is easy, I just needed to not only modify the position name in the organization tree, but also directly add a renaming!Html.button suggestion "Is this the correct position name?" (position, renamings) (\_ -> (suggestion, renamings ++ [(suggestion, position)]))
Therefore, the previous step would have kept the display name "Apprentice".
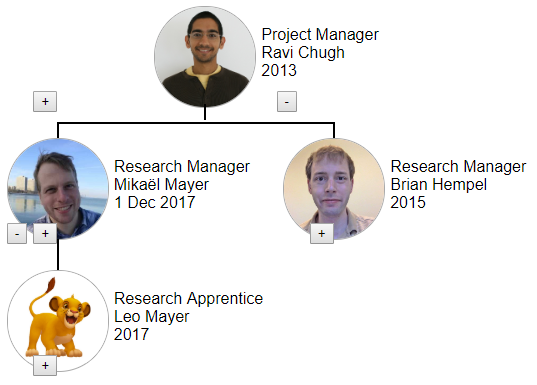
This saved me tons of time and ensured that the organization tree was consistent with the renamings. - Finally, I needed to add and remove some people around. Instead of going back to where I defined the chart, I found out that I could also integrate in the display two buttons, one to add a new child to the tree, and another one to remove all children:
Html.button "+" "Add a child" children
    ((++) <| [Leader "TODO" []])
Html.button "-" "Remove children" children (always [])
One of the interesting points found nowhere in other programming models is that I don't need to define how to walk the tree to insert the new Leader: Because the updates evaluate the program in reverse, it will insert it at the correct location in the tree.
The final interface looked like:
And of course, I added a CSS media query for printing that removed all the buttons when I print the page
<style type="text/css" media="print">
button {
 display: none !important;
}
So far so good. But not everything was beautiful.
What Editor caused me pain for
Editor is still experimental and academic. I found many bugs and performance bugs while using it, that provide the hint that much more work is needed before it can get widespread adoption. Here is a small list:
- Editor does not work well with huge amounts of data. If I display 20 organization charts at the same time (more than 150 people) and try to update, after 2-3 times I encounter memory exceptions. I had to develop organization charts by commenting the ones that I created before.
- I discovered bugs while performing multiple updates at the same time that crashed the system. Fortunately, all the files were always written on the file system so I did not experience any loss..
- Editor is slow to update when the file gets larger and larger. It was not unusual for me to wait 20 seconds to delete a simple character.
- Furthermore, I had to wait that the previous modifications were taken into account before making new ones, which really slowed me down sometimes. I went back to code editing multiple times instead of sticking to visual edition.
- Many times, I want to modify attributes or styling, but I had no other way than going to devtools or edit the code itself. Having a contextual style and attribute editor would have make my life much easier.
What Editor is good at
The reason why I chose Editor instead of a WYSIWYG editor like Smartdraw is that I feel more comfortable in programming things I already know (HTML, Javascript, CSS) rather than a new file format with tons of APIs. To sum up, for this use case, Editor was good at:
- Writing any kind of dynamically generated HTML page and back-propagate any modifications back to the source code
- Letting you edit the page using the DOM inspector or elements using the
contenteditableattribute - Resolving ambiguities by asking questions (are you trying to modify the template, the plug-in or the underlying data?)
- Letting you add custom editing buttons
- Keyboard shortcuts to save the page
Editor has many other features that are promising for other kinds of applications
- It lets you edit links, drag pictures where you need them (like google docs, but on any page)
- It starts a server in which you can not only browse directory, but also rename and delete files
- It renders Markdown files but lets you edit them visually
- It supports HTTPS to create secure servers, and experimental authentication
- It is compatible with Grammarly, Ace editor, Google Analytics, Google Sign-in, and provides an API to make pages compatible with other plug-ins that otherwise blindly modify the page
- It can open desktop files like a real application in Windows, it's just that it launches a temporary server and opens a tab in your browser
Conclusion
I still think Editor was the most adapted tool to develop these organization charts, and I am looking forward using and developing the new version of Editor. Oh, and by the way, Editor is open-source and welcomes contributions. Also, follow me on Twitter to know about the next releases.
There is a Pull Request that highlights the interface elements that Editor made possible and that I described in this post.
--
This work was supported by Swiss National Science Foundation Early Postdoc.Mobility Fellowship No. 175041